Bihar Election Infographics
Graphics that tell the story of the 2025 Bihar assembly elections
Our infographics make an already exciting Bihar election season even more interesting. A picture is worth a thousand words and an infographic can tell numerous stories. Explore the interesting election facets of Bihar through News18's continuing series of infographics.
#5OCTOBER 01, 2025 | 9:53 IST
Biahr Assembly Elections 2025: Poll of Exit Polls
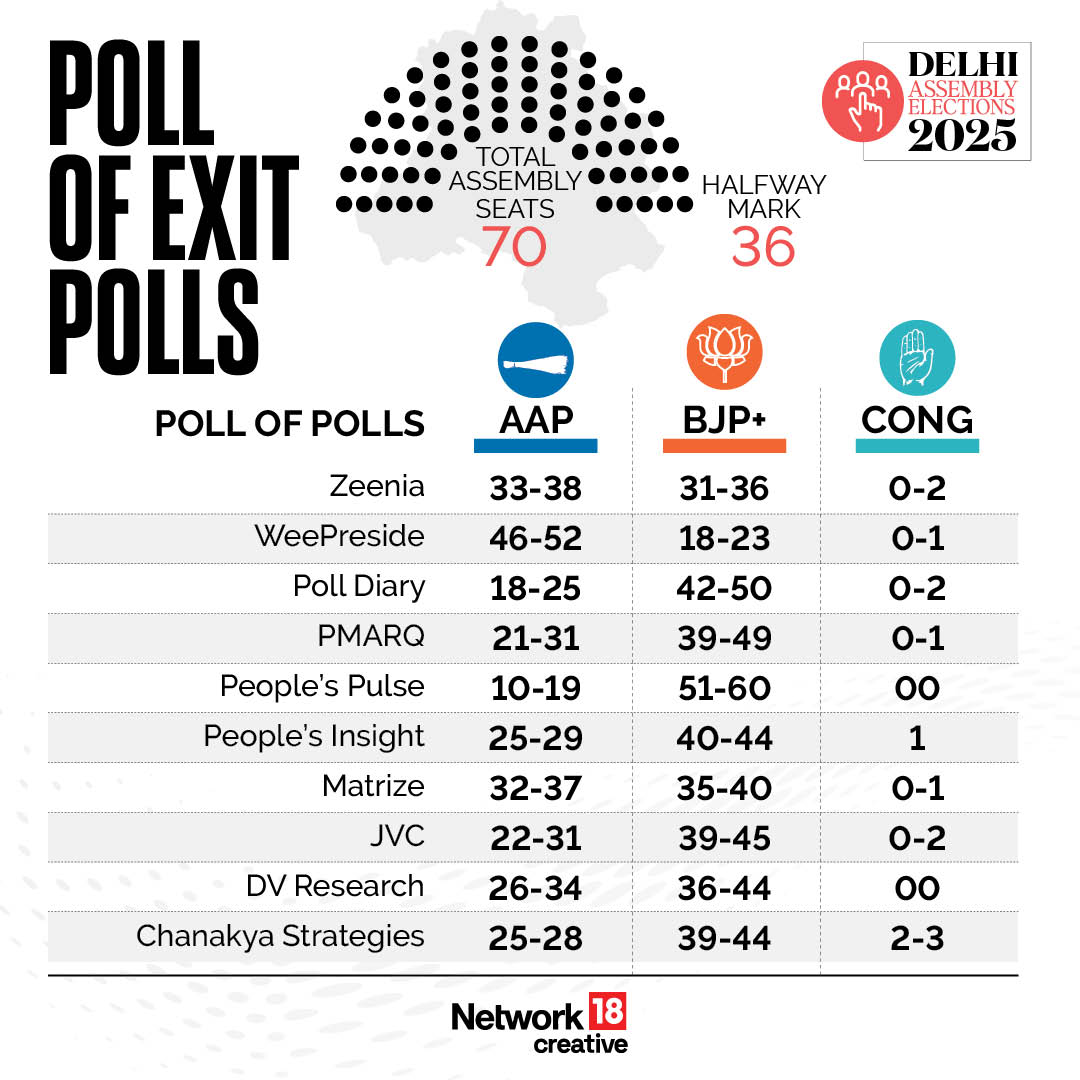
#4OCTOBER 01, 2025 | 9:52 IST
Bihar Assembly Elections 2025: Candidates in Fray
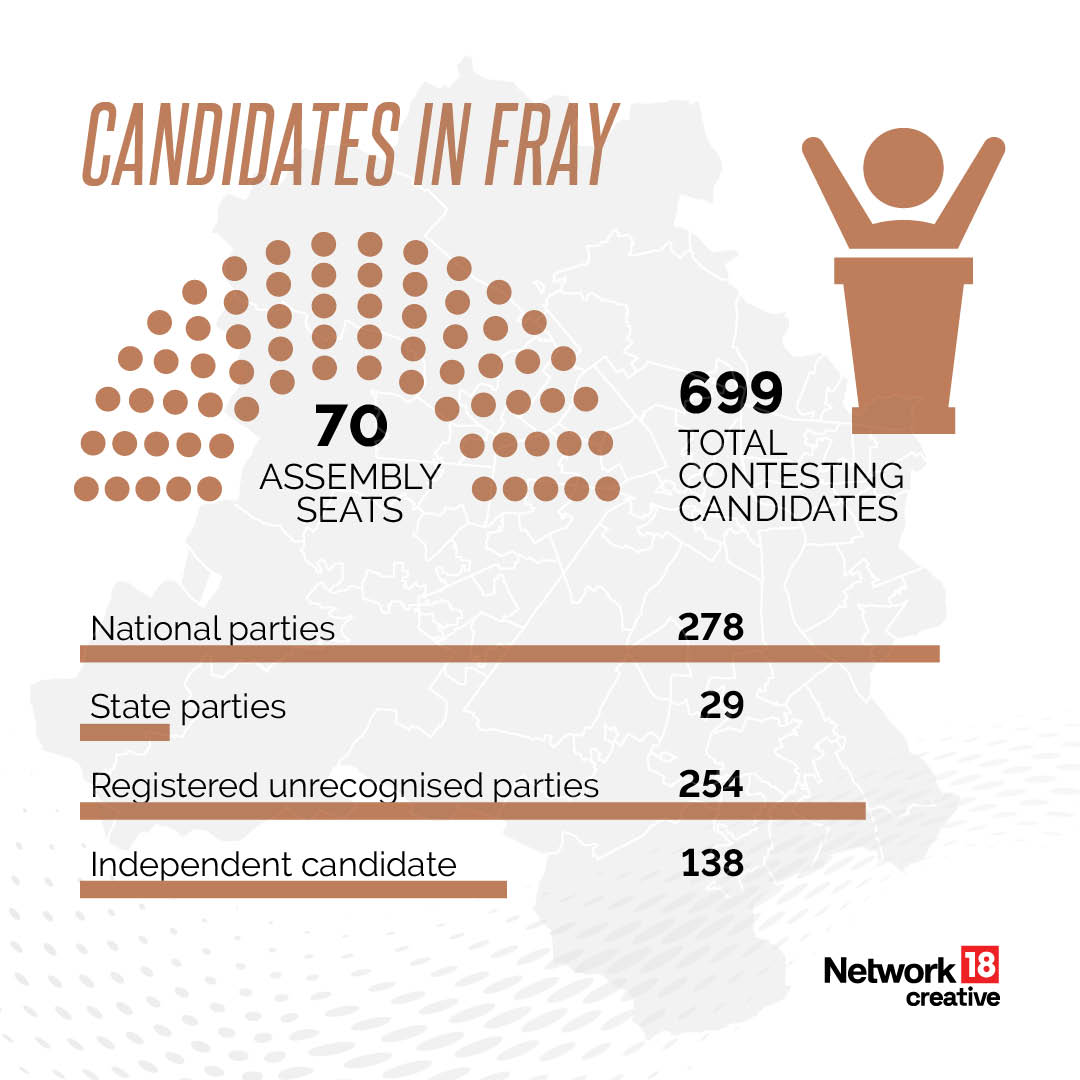
#3OCTOBER 01, 2025 | 9:51 IST
Bihar Assembly Elections 2025: Men Vs Women
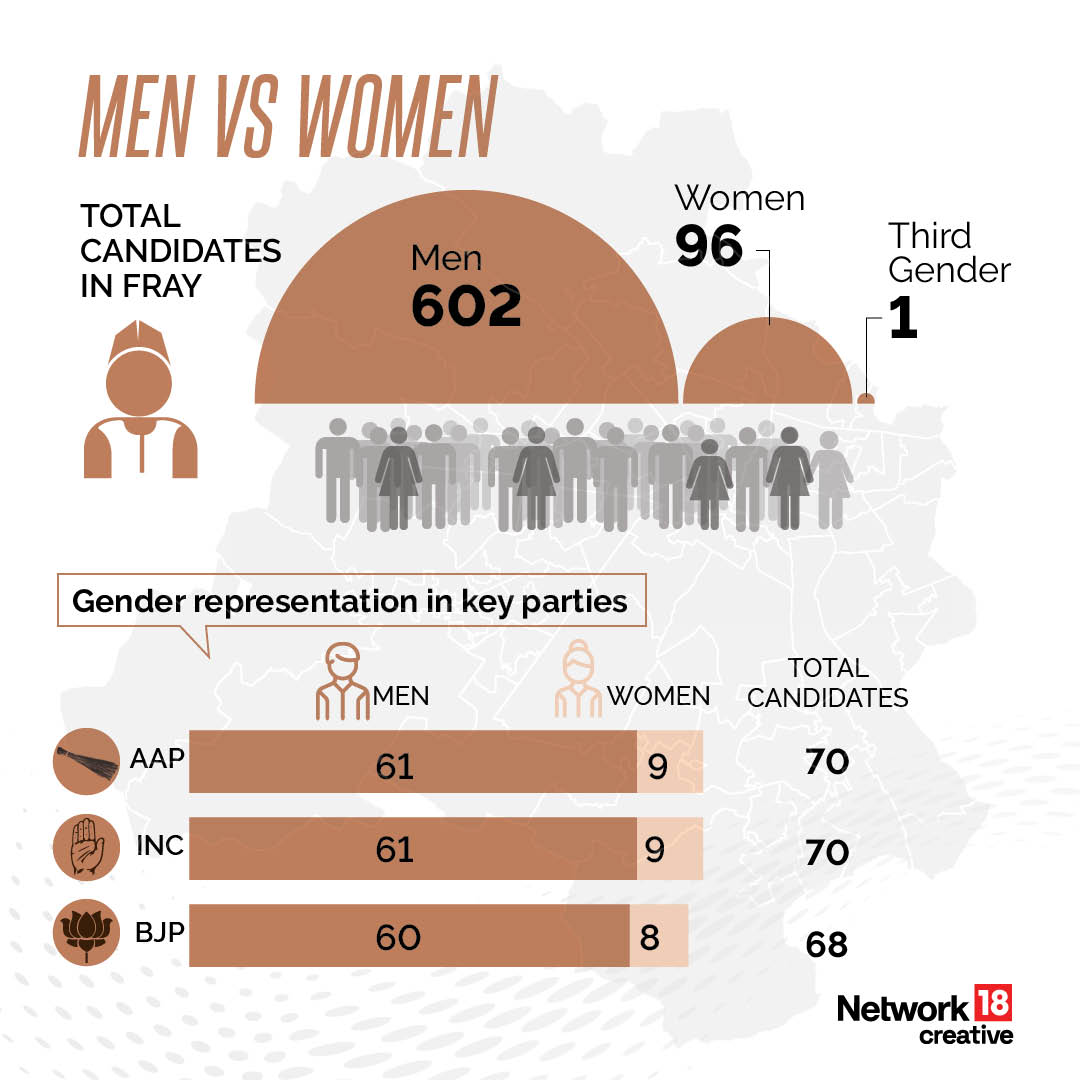
#2OCTOBER 01, 2025 | 9:51 IST
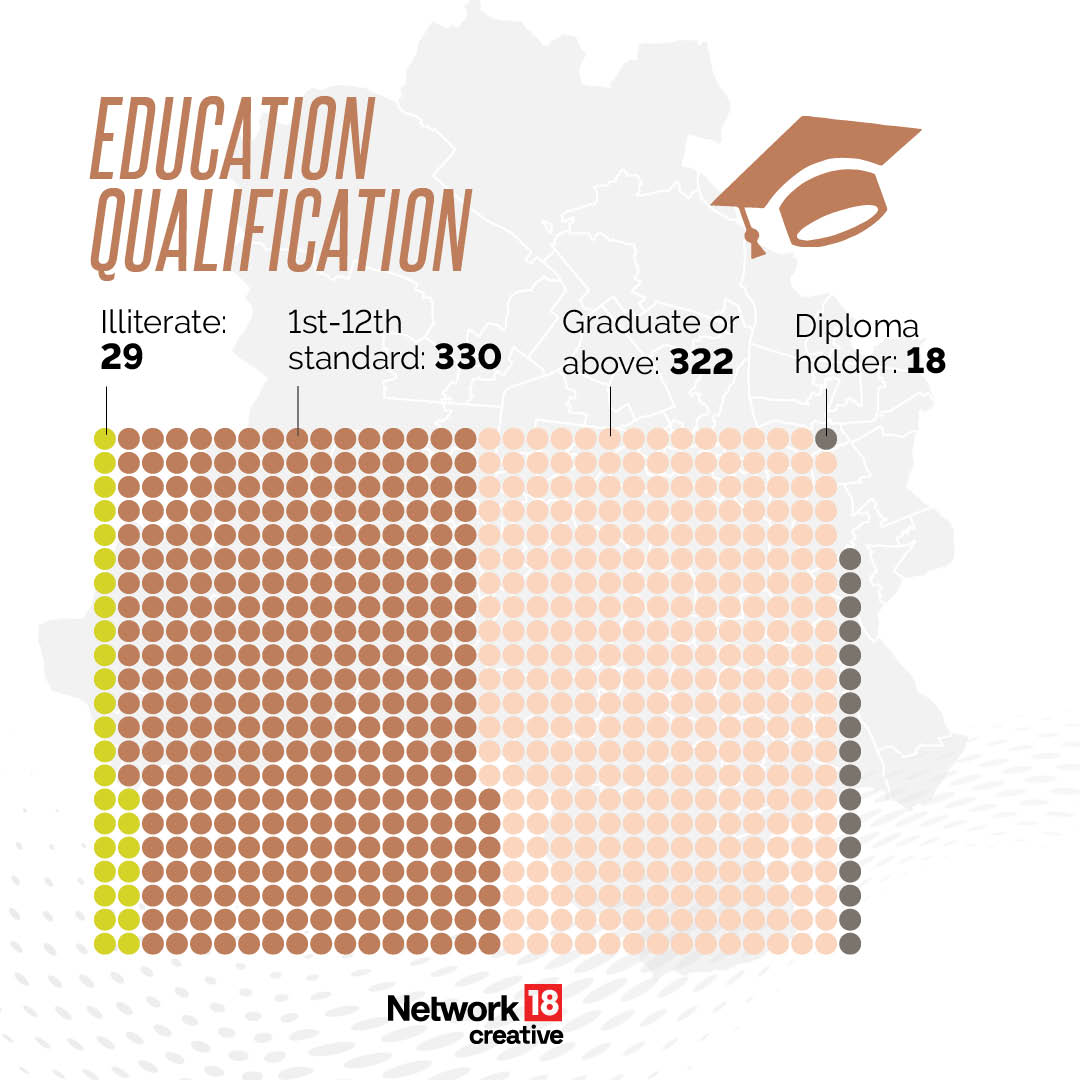
Bihar Assembly Elections 2025: Education Qualification
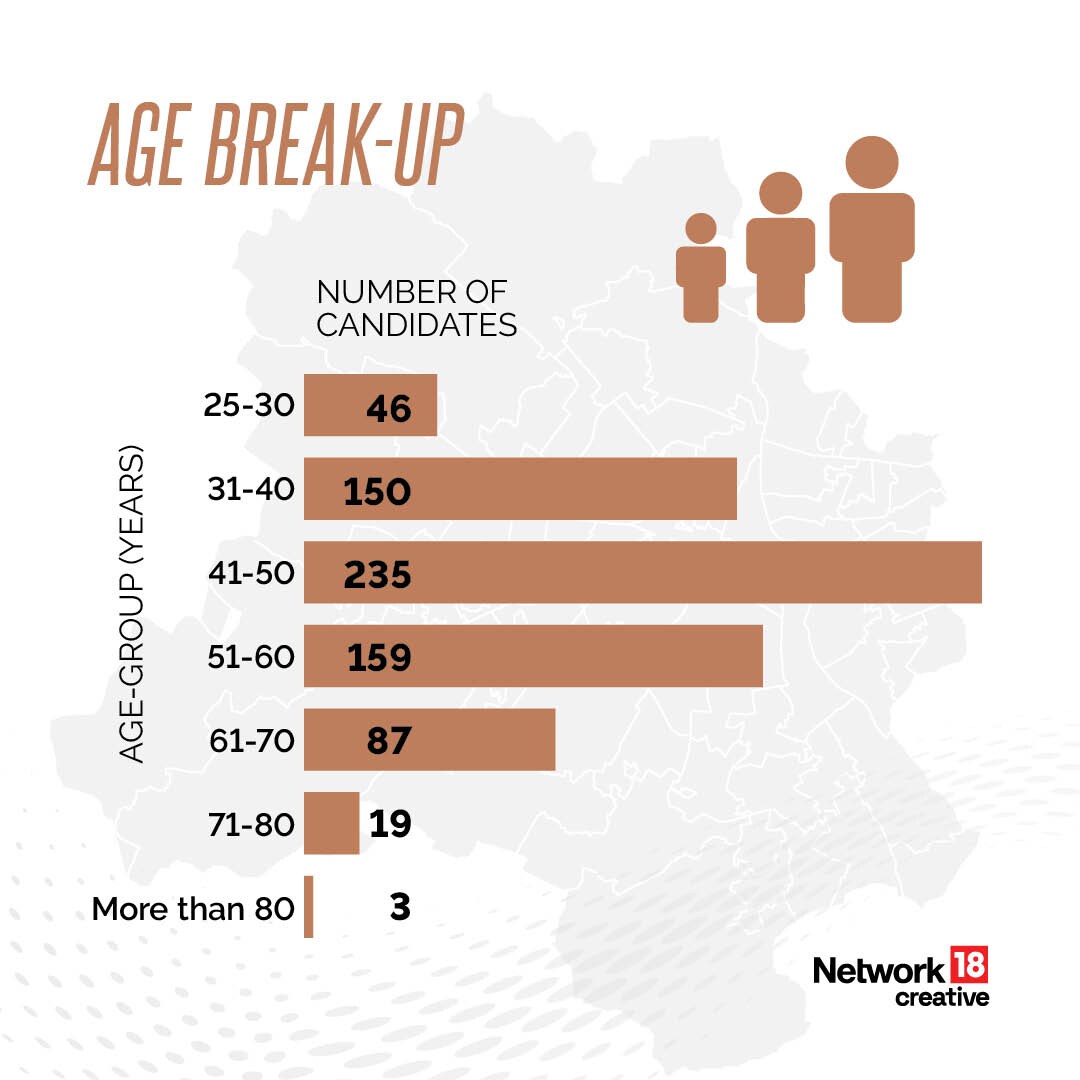
#1OCTOBER 01, 2025 | 9:50 IST
Bihar Assembly Elections 2025: Age Break-up